Capturing startup time
The main purpose of this package is splitting bundle by two parts: the first, relatively small which you can load at the start of your application, and the second, where you will keep the rest part of your application. Such way allows significantly decrease initial startup time and practically reduce it to the same time as in an empty application created via react-native init command. Let's look how we can capture the startup time of an application and understand, how much did you win with the usage of this library.
Below are two ways to measure the start time of the application.
Using react-native-startup-time library
Library that you need to install
First of all you need to install 3rd party package, that allows you to capture the startup time. I'd recommend you to start using react-native-startup-time. So let's start with this library.
yarn add react-native-startup-time
# or with npm
# npm install react-native-startup-time --save
This library is need in react-native linking. So if you are using react-native <= 0.60 you need to go through manual step of linking that you may find in the docs of this library.
Integration to an application
After installation you need to integrate it to your application. Basically there you have two ways of usage:
- as JSX-element
- imperative call
I would highly recommend you to capture the startup time on application, that builded with minification and in prod mode (at least without the usage of dev-server). In other case, metrics, that you captured may not reflect a real situation.
However in a lot of application the most common used approach is deleting any console.log statements in application in production mode via babel-plugin, for example. So I'd recommend you use JSX-element approach.
So let's start with JSX-element. First of all you need to add import statement:
+ import { StartupTime } from 'react-native-startup-time';
And after that somewhere in the root of your application you need to add this part of markup:
<StartupTime
    style={styles.startupTime /* optional */}
/>
That's all. Now you are ready to see the real startup time. For this, please, build a production release and run it on a real devices on both Platform (iOS/Android).
In order to see the difference between two versions of an application (with usage of react-native-bundle-splitter and without) you should capture these metrics on both version of application.
For capturing the real metrics you should kill your application after every running.
For a more revealing result you should try to capture results several (I'd recommend at least five) times. In this case you can see the average startup time.
Flipper
Starting from 0.62 react-native has Flipper integration. If you already use this tool you can add react-native-performance plugin and capture a lot of metrics.
You can read detailed instructions on how to set it up in github repo. More likely you will be interested only in runJsBundleStart and runJsBundleEnd performance metrics, but this plugin has support for much more.
In the end you will have visualized results, which should look like the image below:
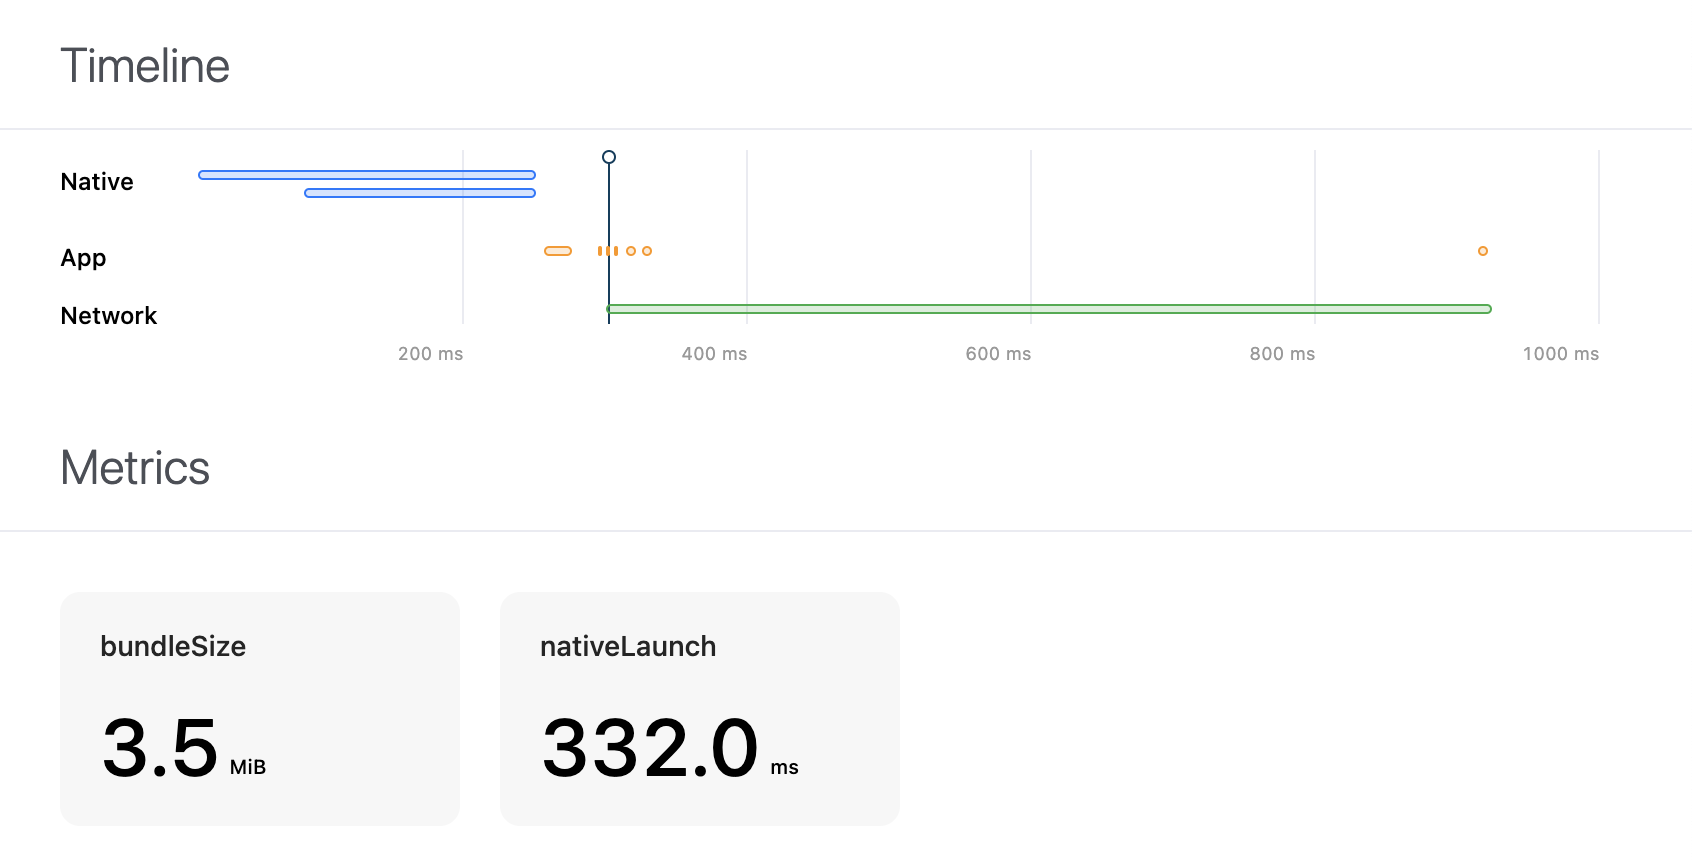
Expected results
On various projects you may get different results. And these results depend only on size and complexity of your js code and static assets. And if you were able to reduce your initially loaded bundle from 50 mb to 2 mb, for example, of course, you may expect significant boost of the performance.
From perspective of my practice I get various results, but the average range was about 0.3-1.5s.
As an example I can show you the performance table from the last project, which I was written.
| Platform | Usage of react-native-bundle-splitter | Time (ms) | Average |
|---|---|---|---|
| Android | ✅ | 834, 861, 820, 847, 816 | 835.6 |
| Android | ❌ | 1374, 1325, 1310, 1281, 1354 | 1,328.8 |
| iOS | ✅ | 1074, 1056, 1044, 1068, 1052 | 1,058.8 |
| iOS | ❌ | 1784, 1767, 1798, 1779, 1783 | 1784 |
As you can see the difference in startup time is ~500ms for Android and ~700ms for iOS.
But it doesn't mean, that for your application results will be the same. Each application and each platform is universal - it has own structure and business logic, so there is only one 100% way to know what is the boost of performance you may get - try to integrate this library to your project and see the results.